Dive into the world of Basic technical analysis for cryptocurrencies and transform how you interpret market trends in your trading journey. Ever stared at a crypto chart and felt like you were trying to read hieroglyphs? Well, it’s time to demystify those complex patterns and charts. We kick off with crypto chart analysis – it’s all about spotting the right patterns to predict your next move. We’ll cover the core chart types and their layouts; you’ll be reading them like a pro in no time. Then, we’ll level up to decode vital technical indicators that could be the game-changers in your trading decisions. Moving averages, RSI, MACD – they won’t be just acronyms to you. Lastly, we decipher market dynamics with a drill down into support, resistance, and volume analysis – trust me, these will become tools you can’t afford to ignore. So, buckle up; we’re just getting started on a journey to trade with confidence using technical analysis!
Understanding the Basics of Crypto Chart Analysis
Deciphering Candlestick Patterns in Cryptocurrency Trading
Candlestick patterns is a big deal in trading crypto. They look like little candles. These “candles” show prices’ up and down moves. The “body” of the candle is the main price change. The “wicks” are the high and low points.
Red candles show price going down. Green candles show price going up. Just like a traffic light, red means stop; green means go. Traders love candle patterns because they can signal if prices might rise or fall.
One easy pattern is the “Hammer.” It has a short body with a long wick underneath. It often means prices could start to climb. The “Shooting Star” is the opposite. It has a small body with a long wick on top. This can mean prices might drop soon.
Trading is like a secret code; candlestick patterns help us break it.
Grasping the Essentials of Crypto Chart Types and Layouts
Crypto charts can look like a wild squiggle, like your heartbeat in a video game. But each “beat” tells a story. Line charts are simple; just a line showing price changes. They’re like drawing a hill you walked up and down on.
Bar charts are a bit like line charts. They show opening and closing prices as bars. It’s like marking the height you jumped in the air at the start and end of each jump.

Now, meet the “candlestick” again short and sweet. They combine all – open, high, low, and close prices – in one look.
Lastly, get this: “Heikin Ashi” charts. They’re special candles that show trends clearer. Think of it as smoothing out a wrinkly shirt, so you see the shape better.
Understanding these helps you see where prices may go. It’s like learning the rules of a game to play it better.
Remember, these are tools to help you. They are like clues in a treasure map. They don’t promise gold but can lead you closer. That’s the thrill of trading – using knowledge to find rewards.
Leveraging Key Technical Indicators for Crypto Analysis
Utilizing Moving Averages to Identify Market Trends
Moving averages smooth out price data. They show a line on your chart. This line represents the average price over a certain period. Think of it like a line that follows the price at a distance. It helps you see where the price may go next. They come in different types like “simple” and “exponential”. Simple ones are more general. Exponential ones give more weight to recent prices.
To use them, look at how the price moves relative to the line. If the price is above the line, we could be in an uptrend. If it’s below, a downtrend might be here. When these lines cross, it could hint at a trend change. This is super handy for making smart trades.
Interpreting RSI and MACD for Crypto Trading Signals
The RSI tells us if crypto is sold too much or not enough. This can hint if a price change is coming. A high RSI (over 70) means it might be overbought. This could mean a price drop soon. A low RSI (under 30) suggests it might be oversold. Prices could rise from here.
MACD is like a double-check tool. It follows trends and momentum using two lines. These are the MACD line and the signal line. Watch where they cross. If the MACD line crosses above the signal line, it’s a buy sign. A cross below can be a sell sign.
Both RSI and MACD can up your trading game. They give you signals – bearish or bullish. “Bearish” means prices might fall. “Bullish” suggests they could rise. Check both before making a move. They’re not always right, but they help a lot!
Use these tools with others for the best results. No tool is perfect alone. But together, they can give you a clearer picture of the market!
Identifying Market Dynamics with Support, Resistance, and Volume Analysis
Constructing Effective Support and Resistance Levels
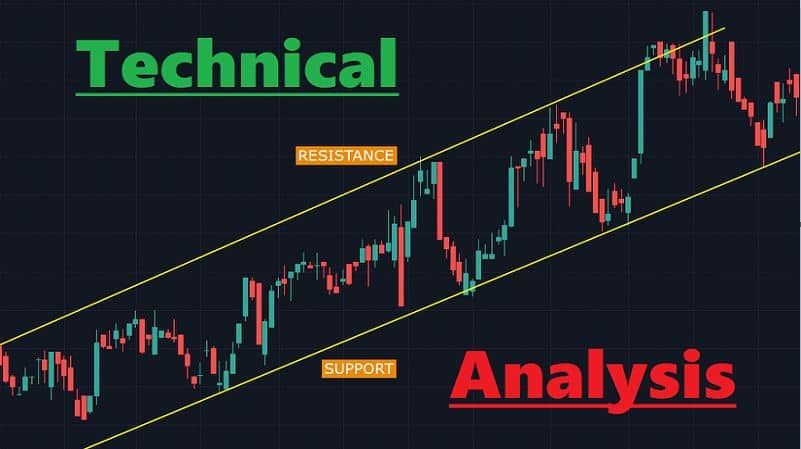
Let’s dive into how crypto charts tell us where prices may head next. First, we spot support and resistance. These are like invisible floors and ceilings for coin prices.
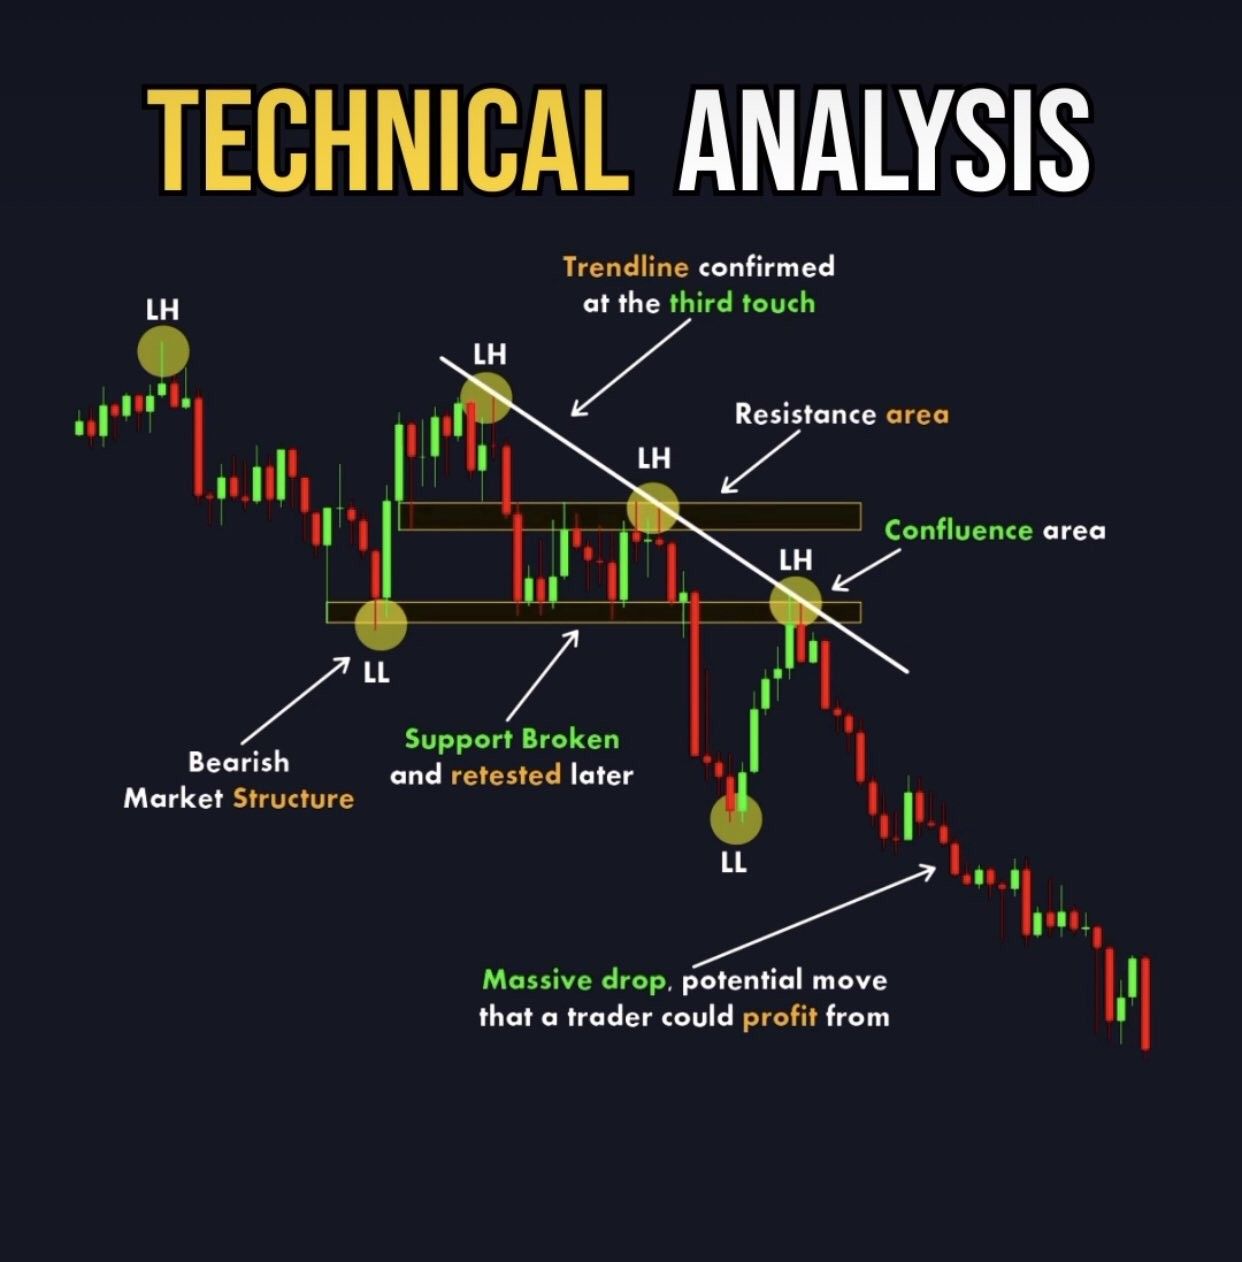
Imagine playing with a bouncy ball in a room. When you throw the ball down, it hits the floor and bounces up, right? That’s like support. It’s where prices tend not to fall below. On the flip side, when you throw the ball up, it can only go so high before it smacks against the ceiling and falls. That’s resistance, where prices struggle to rise above.
Now, how do we draw these lines on a chart? You look for points where prices have turned around several times before. Draw a straight line and there you have it! The more hits a line gets, the stronger it is. Traders watch these closely because prices often bounce off them.
Examining the Role of Volume in Confirming Price Movements
Volume is how much of a coin gets traded. It’s like measuring how loudly people are talking about a coin. A big change in price with a lot of volume? That’s a strong signal!
Let’s say the price jumps, and lots of folks are trading. This means many agree that the price should be higher. But if nobody’s trading at that high price, it might just fall back down. That’s why we always look at volume to confirm what we see in price moves.
To sum up, read the charts for support and resistance. Check how loud the room is with volume. Put these together, and you can guess where crypto prices might go next. And remember, mastering these skills can take you from beginner to pro in no time!
Advanced Techniques for Anticipating Crypto Price Movements
Applying Fibonacci Retracement for Predictive Insights
Let’s dive deep into what often feels like a secret garden of crypto charting: the use of Fibonacci retracement levels. You might wonder, what are these levels and how do they predict price moves? Imagine pulling out a magic ruler that shows where prices may stop and turn. That’s what these levels do.
Think of the last big move in a coin’s price. Fibonacci retracement can show you spots on the chart where the price may pause or reverse based on that move. You draw it from a high point to a low point and it gives you spots, like the 38.2%, 50%, and 61.8% levels where traders watch for action.
Picture those levels as steps. If a coin’s price climbs up a step, traders think it may rest there or even turn back around. If it drops down a step, it could jump back up. This system borrows from an old math whiz named Fibonacci, and it’s like a road map for prices.
Adaptive Strategies for Swing and Day Trading in the Crypto Market
Now, on to the rhythm of buying and selling – swing and day trading. These aren’t just fun terms; they’re styles. Swing traders catch trends for days or weeks. Day traders make their moves within hours or minutes. Both styles depend on reading crypto charts right.
Swing trading is like surfing. You ride the big waves rather than splashing around in the small ones. You find trends using things like moving averages along with watching the candlestick dance. Swing traders wait, patient like a cat, then pounce when the trend is ripe.
Day trading is the fast-paced cousin. It’s all about now. Price moves in your coffee break can make your day. It’s a blend of art and science—knowing the market sentiment, watching volume spikes, and eyeing RSI and MACD to make a quick move.
But watch out – it’s not just about fast clicks. You need a plan. Solid day traders have rules like “Don’t chase a loss” and “Set your exit before you enter.” They plant their trade seeds with care, growing profits bit by bit.
Both styles need a good grip on crypto charts. Use technical indicators to spot the signs, the support and resistance to know where prices may hit a wall or floor, and understand the overall market mood.
Remember, no one wins them all, but the more you practice, the better your garden grows. Stick to the plan, keep your head cool, and watch the charts. The market dances to its own beat, and with these strategies, you’ll be ready to join the party.
To wrap it up, let’s go over what we dug into today. We kicked off with the basics of reading those crypto charts. We saw how candlesticks could give us clues to what’s next. Then, we moved to the different chart types and their setups.
Next, we got into the techy bits, like moving averages, to catch what’s trending and used RSI and MACD to spot buy or sell signals. After that, we talked about market vibes – support, resistance, and how volume shakes things up.
We ended by stepping up our game with some pro moves. Fibonacci showed us how to guess price moves, and we looked at smart ways to trade, whether you’re in it for the long haul on swings or making quick day trades.
I’ll leave you with this: Knowing these tricks can help you make some sharp crypto moves. Stay keen, use what you’ve learned, and don’t forget—keep practicing. That’s how you’ll play the crypto game like a pro.
Q&A :
What is basic technical analysis in the context of cryptocurrencies?
Basic technical analysis in the realm of cryptocurrencies is a method used to evaluate and predict future price movements by analyzing past market data, primarily price and volume. It involves the use of charts and various technical indicators like moving averages, trend lines, and patterns to identify trading opportunities and trends.
How can you start learning technical analysis for cryptocurrency trading?
To start learning technical analysis for cryptocurrency trading, begin with understanding the core principles such as supply and demand, market trends, and support and resistance levels. You can progress by studying chart patterns, technical indicators, and candlestick formations. Engage with online courses, webinars, community forums, and practice with a demo trading account to refine your skills.
What are some popular technical indicators used in cryptocurrency analysis?
Popular technical indicators used in cryptocurrency analysis include the Moving Average Convergence Divergence (MACD), Relative Strength Index (RSI), Bollinger Bands, Fibonacci retracement levels, and the Stochastic Oscillator. These tools help traders identify momentum, trend reversals, and overbought or oversold conditions in the market.
Can you rely solely on basic technical analysis for making cryptocurrency investment decisions?
While basic technical analysis can provide valuable insights into market trends and potential entry or exit points, it’s generally not advisable to rely solely on it for making cryptocurrency investment decisions. Combining technical analysis with fundamental analysis, which examines underlying factors like technology, market sentiment, and news events, can lead to more informed decision-making.
Is technical analysis of cryptocurrencies different from traditional markets?
Technical analysis of cryptocurrencies shares many similarities with traditional markets, using the same underlying principles and techniques. However, the cryptocurrency market is known for its higher volatility, 24/7 trading, and its influenced significantly by market sentiment. These factors can lead to unique patterns and behaviors that traders need to consider in their analysis.


