As a seasoned trader, I know the power of drawing tools on crypto charting tools. They’re like a secret weapon in decoding market trends. Without them, you’d be trading blind, guessing where Bitcoin or Ethereum might head next. But with the right tools, you can slice through the chaos, uncover hidden patterns, and ride the wave of market movements with confidence. Whether you’re learning about the slopes of trend lines or the subtleties of candlestick configurations, these instruments are your ticket to understanding and leveraging the volatile world of cryptocurrency. Now, let’s demystify these crucial tools and turn your crypto charting into a finely-tuned machine that’s ready to tackle even the most complex of market conditions.
The Crucial Role of Drawing Tools in Crypto Analysis
Mastering Trend Lines and Price Channels
Drawing tools are a trader’s best friend. Think of them like X-ray specs that can reveal where prices might head—up, down, or sideways. Using trend lines is simple but powerful. Just draw a line that connects two or more lows or highs on a crypto chart. This is trend line usage in crypto analysis. A rising trend line means “the bulls are in charge,” and prices might go up. When the trend line falls, it’s bear territory, warning that prices might drop. When you see prices break these lines, get ready for action—it means things are changing.
Price channels take trend lines further. Imagine a road the price is driving on. The lines are like curbs on the sides. They keep the price in check. A break through these curbs signals a potential turn in the market direction. Drawing price channels can help you guess where prices may stop and start.
Both tools are key in reading the market’s moves. They can guide you. They tell you when to get in and out of trades. Smart use of these tools can make or break your game.
Proficiency in Candlestick Pattern Recognition
Know those little bars that look like candles on a chart? They tell a powerful story. Each candle shows how prices moved in a set time. Candlestick pattern recognition is like learning a secret market language. Each pattern has a fancy name—like “bullish engulfing” or “doji”—and tells us about buyers and sellers’ tug-of-war.
Some candles mean “Get ready, prices might jump” or “Watch out, prices might fall.” It’s all about spotting these patterns early. Recognize a few candles in a row making a pattern? It could tip you off on what’s coming next in the market.
Candlestick patterns work great with volume indicators. Volume shows how much crypto was traded. It’s the fuel to the price action car. See a pattern and lots of volume? That’s a strong sign.
But those candles can fool you if you’re not careful. Always check them against other tools, like MACD indicators or RSI divergence. You want signs to line up. It’s like getting a second opinion before making a big decision.
These drawing features let you tell the chart’s story in your own way. You choose the tools that suit your story. And the better you get at it, the more your story might just end up with a happy ending.
Learning these skills takes practice. But once you get it, you’ll see the crypto markets in a whole new light. It’s like having a roadmap for the twists and turns of trading. So grab your drawing tools and start sketching the future!
Advanced Technical Analysis Techniques & Their Applications
Fibonacci Retracement & Harmonic Patterns
In the world of crypto, drawing tools are key. They light the path to buying and selling. Think of them as a map. They guide you through the wilds of the market. One must-have tool is Fibonacci retracement. It shows where prices may turn or steady. You find key levels with it. These are spots where crypto often sees action. Picture them as invisible barriers.
Harmonic patterns take this a step further. These complex shapes are like secret messages in price charts. They form based on Fibonacci numbers. Traders watch them close. They aim to predict where prices could go next.
Incorporating Elliott Wave Theory and Gann Angles
Next up, we dive into Elliott wave theory. This nugget sees the market in waves. It says price moves in clear patterns. These patterns repeat over time. Knowing this, traders try to tell when a trend may start or end.
Gann angles are a touch different. They mix time, price, and pattern. They help traders find the best buy and sell points. By drawing these angles, you tie time to price moves.
Both tools dig deep. They demand practice but offer much back. With them, you clear the fog off your crypto charts. You see not just the now, but a peek into the future.
By mastering these tools, you gain an edge. You read the language of the charts. This lets you make smart, sharp moves. It’s all about finding patterns in the chaos.
So, grab these tools. Learn their ways. Let them lead you to your trading goals.
Integrating Indicators and Drawing Tools for Market Insight
Combining MACD, RSI, and Bollinger Bands with Chart Patterns
Have you ever played connect the dots? It’s like that in crypto charting too. You draw lines and curves to see where prices might go. It’s fun and super useful! Let’s talk about how to mix drawing tools and technical stuff for smarter trades.
First up, when you mix MACD, RSI, and Bollinger Bands, it’s like having a secret map. MACD shows if bulls or bears are in charge. RSI tells you if a coin is too hot or too cold. Bollinger Bands are like a track for prices, showing if they’re out of whack. When prices break out of their Bollinger track, watch out – big moves can happen!
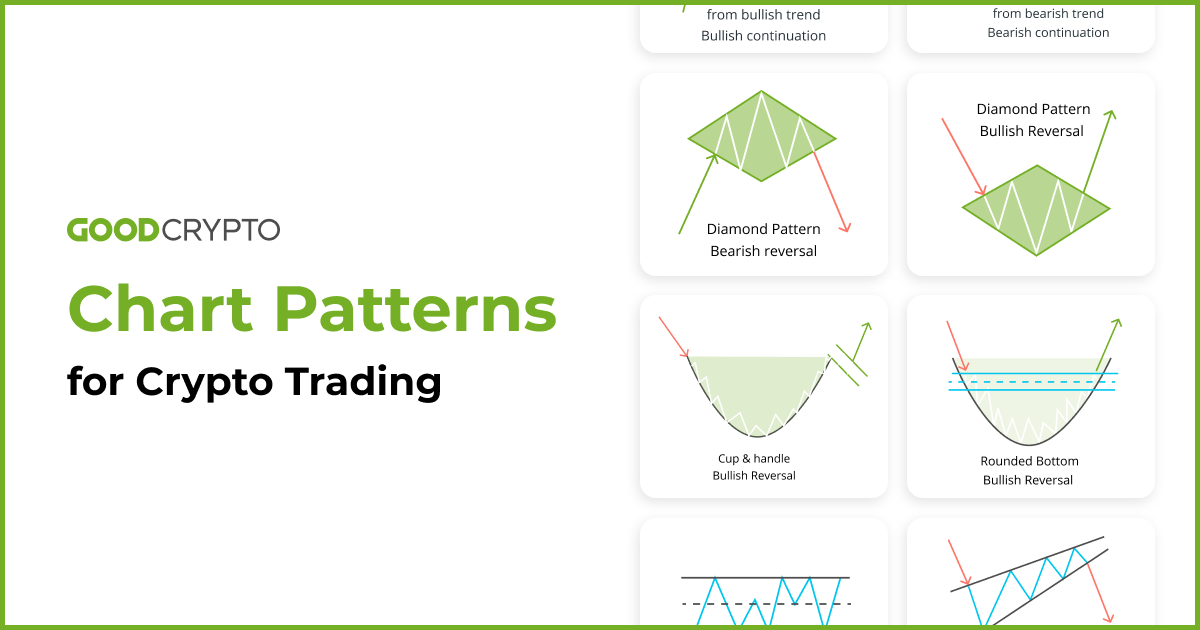
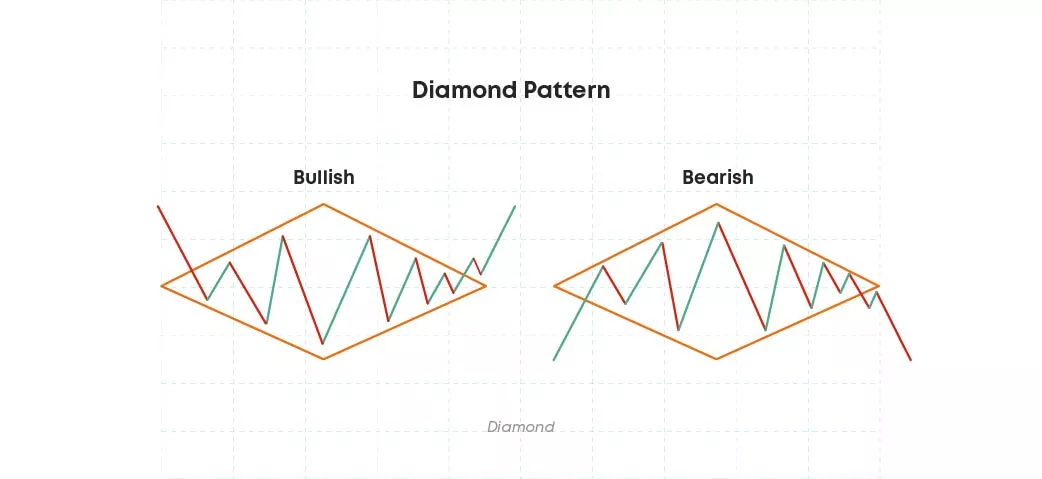
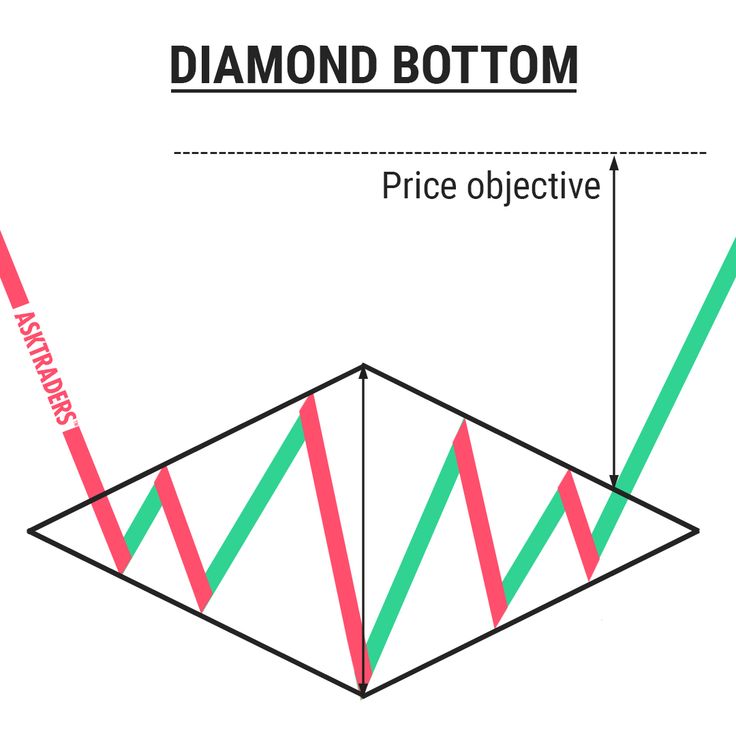
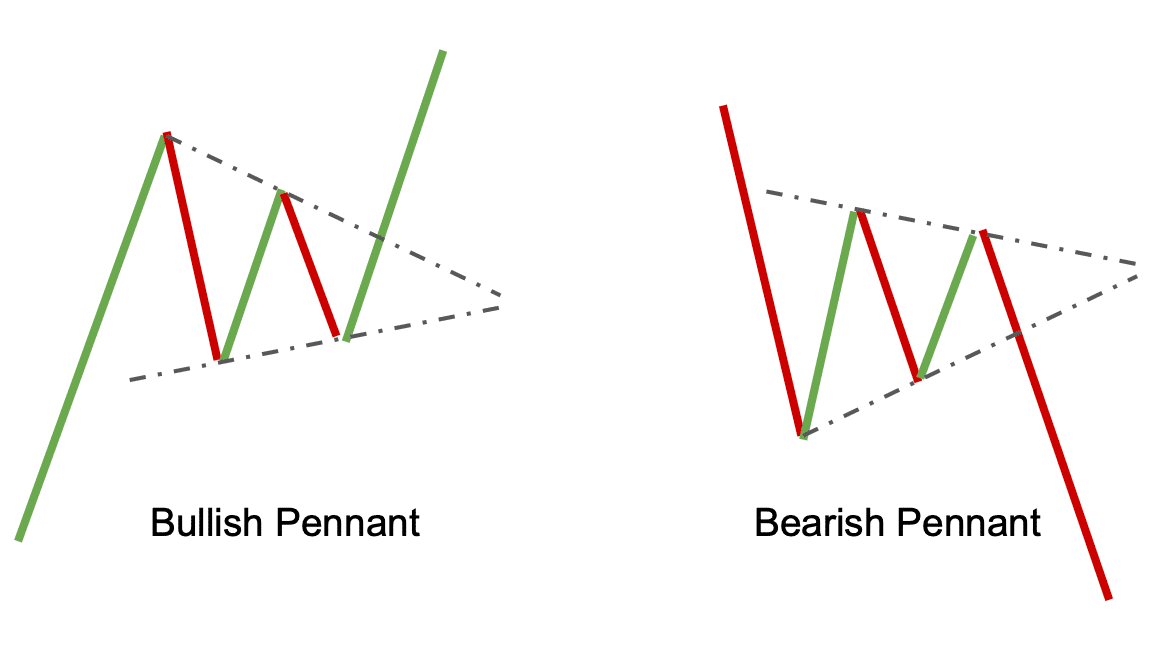
Now, chart patterns are like clues in a game. They help you guess what comes next. Some look like triangles, while others look like heads or cups with handles. When you spot these patterns and check them with your MACD and RSI, you get powerful hints about what’s up ahead.
What’s the big deal with these hints? Well, they can tell you when to jump in or out of a coin. If MACD goes up while RSI says it’s not too hot, plus your pattern looks bullish, you might want to buy. But if it’s the other way around, it could be sell time. Neat, right?
Leveraging Volume Indicators and Moving Averages
Let’s not forget about volume and moving averages. They’re key to picking winners. Volume is how many coins are trading hands. It shows if moves are for real or just fake outs. Think of it like a cheer squad – the louder the cheers, the bigger the game.
Moving averages smooth out price wiggles. They give you the clean story. If prices are above their moving average, it usually means good times are rolling. Below it? Time to buckle down.
Combine moving averages with volume, and you get a super-duo. If prices push past their average on high volume, chances are they’ll keep running. But if volume’s low, don’t bet the farm – it could be a trap!
For crypto traders, blending these tools is like making a magic potion. You use the best bits from each to get a crystal-clear picture of where your coin could head next.
What’s the main takeaway? Use all the tools – patterns, MACD, volume, and so on. They each tell part of the story. Together, they can guide you through the crypto jungle. Grab your drawing tool, use it right, and you may just find treasure!
Enhancing Your Charting Strategies with Specialized Tools
Drawing and Annotation Techniques for Clarity
When you trade crypto, drawing tools are your best friends. They make charts easy to get. Think of them as markers. They mark spots you need to watch. You see, drawing on your crypto charts helps point out key areas. Like where support and resistance levels are. And you need this clear view to make smart moves in trading.
Let’s break it down. A trend line is a straight line you draw over price highs or lows. It shows you the direction the price is moving. Fibonacci retracement helps too. It’s a tool that finds where price might turn or keep going. It uses lines based on a math sequence. This gives you levels to look out for.
You can’t forget volume indicators. Volume shows how much trading is going on. It’s important because it can tell you if a price move means something. If volume is high and price goes up, that’s a strong sign the trend might keep going.
Using MACD is like having a sixth sense for the market. It tells you about the trend strength. And about possible price changes. This helps a lot with your choices in buying or selling. Bollinger Bands are cool too. They show you if the price might be too high or too low. This could signal a price move.
Lastly, there’s RSI divergence. RSI, or Relative Strength Index, compares recent wins and losses. Divergence happens when the price is going one way, and RSI is going another. This can warn you of potential trend changes.
Comparative Analysis of Crypto Charting Platforms
Now, let’s talk about the tools themselves. There are many crypto charting tools out there, and each has cool drawing features. But not all of them work the same. Some are better for beginners, and others have advanced features pros love.
TradingView is a favorite among many traders. It’s got loads of tools and is quite easy to use. But there’s more than just one good platform. Coinigy is another one that’s great for keeping track of different accounts.
What about when you want to compare these tools? It’s wise to look for things like how smooth it is to draw on the chart. And if the tools you need most, like Fibonacci or Bollinger Bands, are there. You should also check if you can save your chart work. This saves time when you’re jumping back into trading.
In the end, the best tool is the one that fits your needs. It should have all the features you want and be easy for you to use. But remember, the best chart with the fanciest tools won’t help if you don’t understand the basics. So, get to know trend lines, volumes, and indicators first. Then, these tools can help you chase those profits. They turn complex data into clear snapshots. This lets you act fast, smart, and with confidence. And that’s how you win in the quick-moving crypto market.
In this post, we dived into the key tools for analyzing crypto. We looked at how trend lines and price channels mark the path prices might follow. We also saw how candlestick patterns can warn us about future price moves.
Then, we explored advanced techniques like Fibonacci and Elliott Wave Theory to predict market changes. Tools like these can really help you see where crypto prices may go.
We also talked about pairing indicators and drawing tools. This mix gives us a clearer picture of market trends. Think of it like finding clues in a detective story.
Lastly, we touched on the power of having the right charting tools. They make our data easier and clearer to understand. We compared different crypto charting platforms too.
My final thought? Using these tools wisely can be a game changer. They give you a sharp view of the market. It’s amazing how drawing a simple line or spotting a pattern can reveal where prices could head next. Keep practicing these techniques. You’ll get better at making smart moves in crypto trading.
Q&A :
What are the essential drawing tools found on most crypto charting tools?
Drawing tools are integral for technical analysis in crypto trading. Key drawing tools include trend lines, Fibonacci retracement levels, support/resistance lines, and various chart patterns like wedges, triangles, and channels. Additionally, annotation tools such as text boxes and arrows help traders mark important notes on their charts.
How do drawing tools on crypto charting tools enhance trading?
Drawing tools enhance crypto trading by allowing traders to visualize patterns, identify trends, and mark key price levels on the charts. By using tools such as trend lines and Fibonacci retracements, traders can make informed decisions on entry and exit points, helping to manage risk and secure potential profits.
Can you save and customize drawing settings in crypto charting tools?
Yes, many advanced crypto charting tools provide options to save and customize drawing settings. Traders can save templates with their preferred indicators and drawing tools, enabling them to quickly apply their personalized analysis framework to any cryptocurrency chart they are reviewing.
Are there any free crypto charting tools with advanced drawing capabilities?
Several crypto charting platforms offer free access to basic drawing tools, but advanced tools may require a paid subscription. Tools such as TradingView and Coinigy provide a range of free drawing tools with the option for more sophisticated features at a premium.
What is the significance of accuracy in using drawing tools on crypto charting software?
Accuracy is paramount when utilizing drawing tools on crypto charting software because it directly impacts the analysis outcome. Precisely drawn trend lines and correctly positioned Fibonacci levels ensure that traders are basing their decisions on reliable information, which can potentially lead to more successful trades.


